What is kpLogo
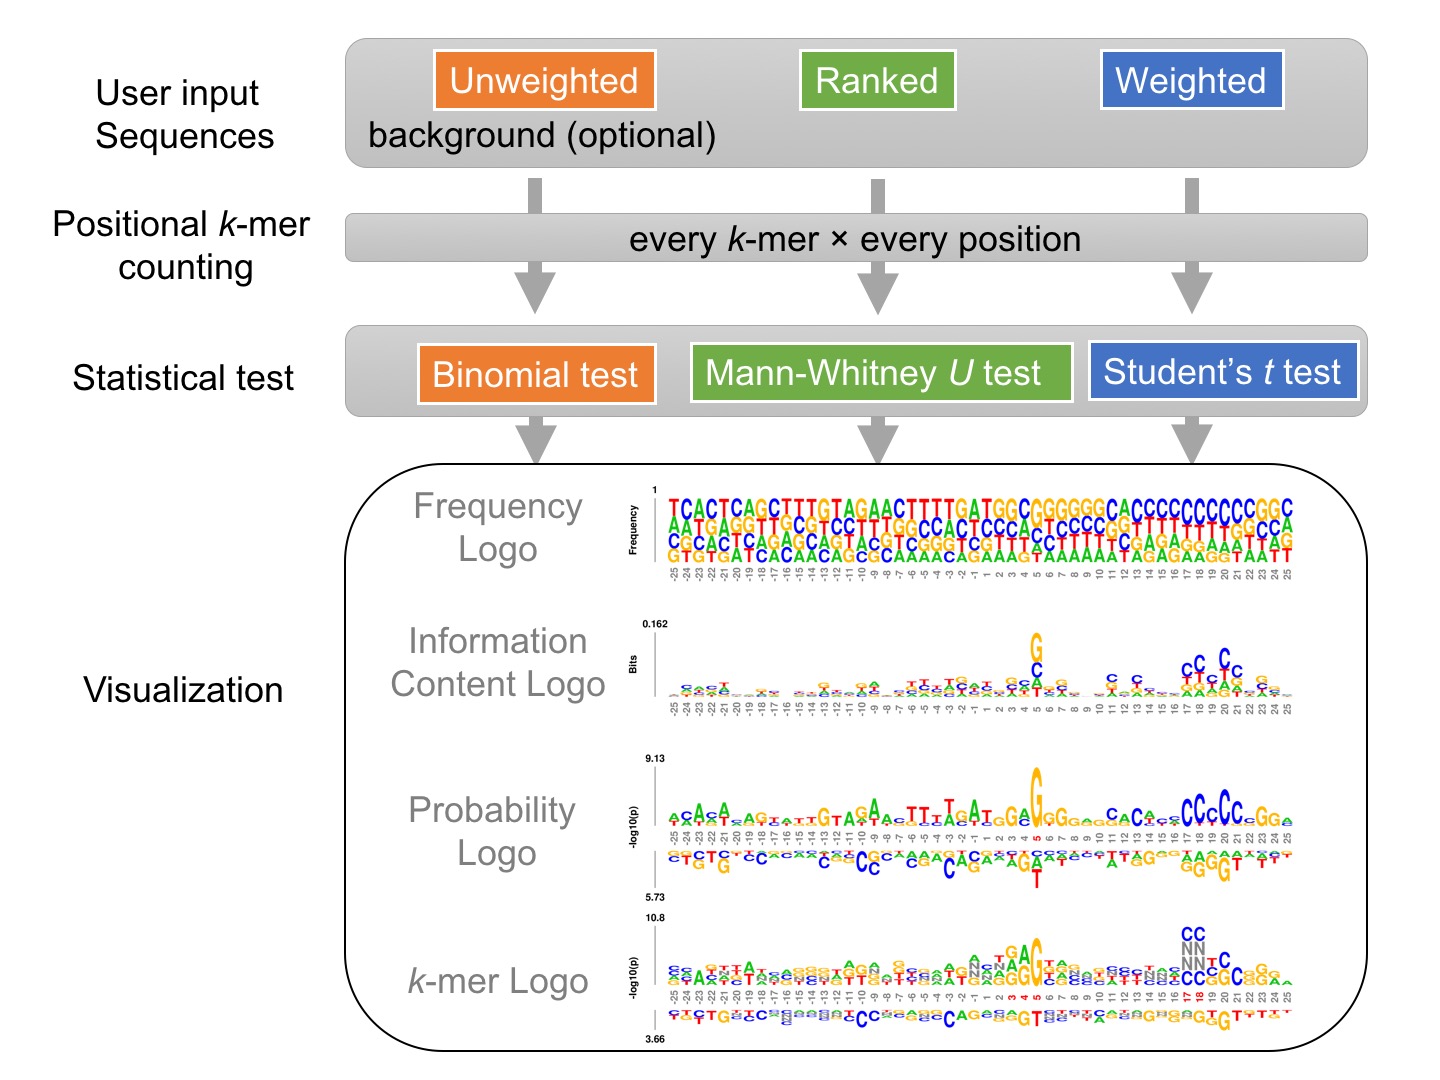
k-mer probability logo (kpLogo) is a probability-based logo tool for integrated detection and visualization of position-specific ultra-short motifs from a set of aligned sequences. kpLogo also overcomes the limitations of conventional motif-visualization tools in handling positional interdependencies and utilizing ranked or weighted sequences increasingly available from high-throughput assays.Given a set of sequences of identical length, either unweighted, weighted, or ranked, kpLogo enumerates all possible k-mers of user-specified lengths, evaluates their presence at each position in all input sequences, and reports their enrichment and depletion at each position as determined using an appropriate statistical model. To visualize the results, kpLogo generates a unique type of logo plot called the k-mer logo, in which at each position the most significant k-mer is plotted vertically with the total height scaled to its P value (log10 transformed) or test statistics, as appropriate. In addition to k-mer logo, kpLogo also generates logo plots for monomer frequency and information content.
The diagram below highlights two overlapping CNNC motifs at specific positions within primary transcripts of human microRNAs, which are important for microRNA processing (see Examples):
Limitations of current motif tools
Existing motif discovery tools and visualization tools have fundamental limitations, but there are also strong synergy between them:Motif visualization (sequence logos): 1) cannot handle weighted or ranked sequences; 2) models positions with single-nucleotide resolution but lack the ability to model and detect positional interdependence in motifs.
Motif discovery: handles weighted or ranked sequences and models positional interdependence, but typically ignores positional information and thus misses ultra-short motifs (with lengths 1-4 letters) or other information-poor motifs whose specificities are conferred by both sequence identity and relative position.
Unique features of kpLogo
kpLogo combines motif discovery with visualization. Compared to other tools that generate sequence logos, kpLogo is unique in several ways:1. handles ranked or weighted sequences
2. performs statistical tests to discover short motifs
3. visualizes not only single letters but also short motifs using k-mer logo
4. plots frequency logo, information content logo, probability logo, and k-mer logo in one run
5. allows degenerate letters (DNA/RNA) and gapped motifs
6. logos can be generated with colorblind friendly colors
Using kpLogo
kpLogo can be accessed as a webserver: http://kplogo.wi.mit.edu. In addition, the C++ source code and the web code can be downloaded and installed locally.Web server
To use kpLogo online, please visit http://kplogo.wi.mit.edu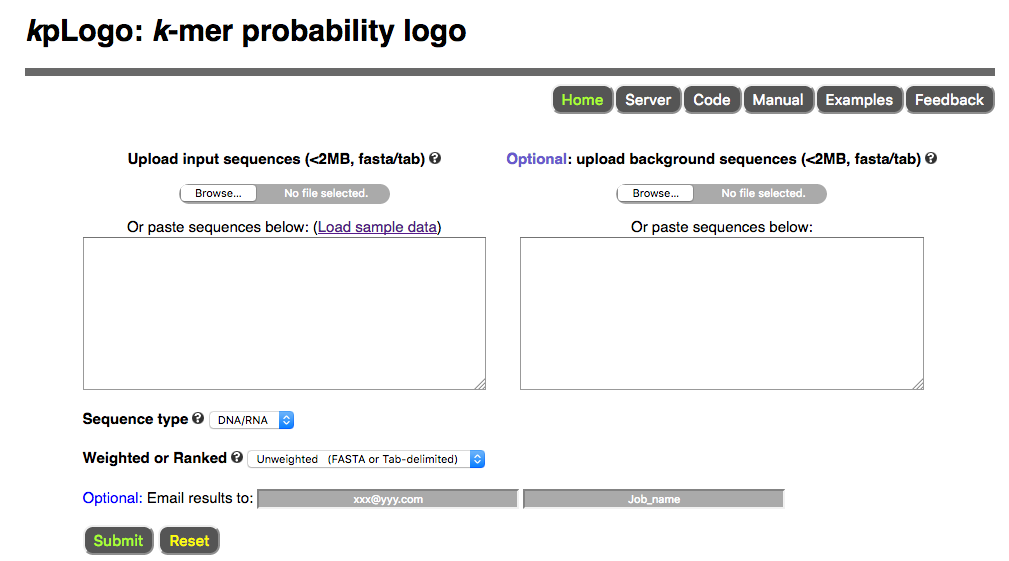
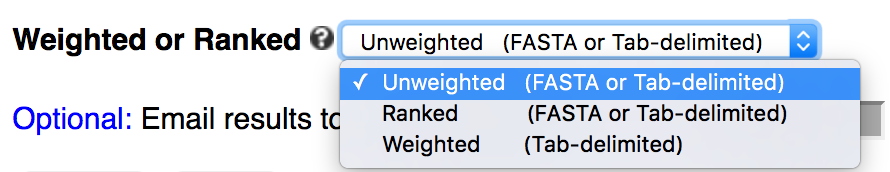
Users paste or upload sequences to the server, choose sequence type (DNA/RNA, protein, or other) and analysis type (unweighted, weighted, or ranked), then submit the job using default setting. Once submitted, users are redirected to the result page which refreshes every second until the job is finished.
Email and data security
Note that user data will be removed 10 days after the job is submitted. Please download the data as soon as it is available. If the user wishes, all data related to the job can be deleted immediately using a button in the result page. No copy of the data will be stored or used for other purposes.
Users are recommended to provide an optional email address to receive notifications. If provided, two emails will be sent: one immediately after submitting the job, and the other after results are available. Both emails contain a link to the result page. The second email contains a PDF file with all logo plots. Note that users need to keep the result page open in a web browser for the second email to be sent. If the result page is closed before the job is finished, the second email will not be sent but users will still be able to open the result page using the link in the first email.Limitations
The web server implements most functionality of kpLogo, and should be sufficient for most users. However, for simplicity and to avoid excess demand of server resources, a few restrictions have been imposed on the web version of kpLogo:- Input file size: Each input file should not exceed 2MB in size.
- k-mer length: the max length of k-mer is limited to 6 for RNA/DNA sequences, and 3 for protein and other sequences.
- sequence shuffling: if choosing to shuffle input sequences to generate the background, one can only preserve up to 4-residue frequency, and for each sequence, shuffle no more than 1000 times.
- model prediction: the binary version allows the user to score a new set of sequences using the positional sequence specificity model learned from the input. The web version does not support this functionality at this moment.
Input
Sequence type: DNA/RNA/protein/other
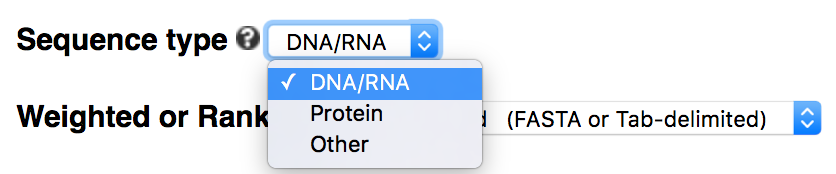
Command-line options: When -alphabet is not specified by users, kpLogo uses the default -alphabet ACGT. Note RNA will be converted to DNA by default so for RNA input there is no need to specify -alphabet ACGU. To run kpLogo on protein sequences, please use -alphabet protein, which is equivalent to -alphabet ACDEFGHIKLMNPQRSTVWY. Similarly, to run kpLogo on other types of sequences, use -alphabet to specify all allowed residues.
File format
Tabular / Column file
kpLogo will treat any of the following characters as delimiter: tab ("\t"), comma (","), vertical bar ("|"), and space (" ").Example 1: minimal ranked or unweighted tabular input
Example 2: minimal weighted input. Note: no need to sort sequences by weight
Example 3: additional columns in input.
In cases like this where the sequences are not in column 1, and / or the weights are not in column 2, then one needs to specify the columns by chaning the numbers in those two boxes:
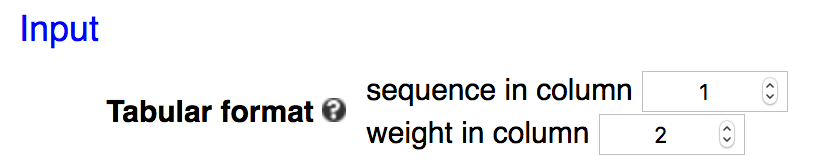
-seq 2 -weight 3FASTA
Here is an example of a FASTA file:Notes on FASTA file format:
1. Each sequence includes an ID line and a sequence line
2. IDs always start with '>'
3. IDs are not used by kpLogo and thus do not need to be unique
4. Sequences do not need to be of the same length (see option
-region)5. Can be treated as ranked (see option
-ranked) but not
weighted (need to use tabular format)
Analyze a sub-region
To analyze only part of the positions, specify the start and end in the textboxes:
start=1,end=0: analyze all positions without trimming. All input sequences need to be of identical length.
start=1,end=10: analyze the first 10 positions. Input sequences need not to be of identical length.
start=-9,end=0: analyze the last 10 positions. Input sequences need not to be of identical length.
start=1,end=-9: analyze all but the last 10 positions, i.e. trim 10 residues from the end. Input sequences need to be of identical length.
Command-line options: -region start,end
Positional k-mer with shift and degeneracy
A positional k-mer (or simply k-mer in this document) is a short sequence of length k associated with a specific position. Throughout this document, a positional k-mer has the format of sequence:position:shift, or simply sequence:position if no shift is allowed (default). For example, most introns start with a GU dinucleotide, and this dinucleotide motif (k = 2) can be represented as GU:1:0, i.e. GU at position 1 with no shift. The position of the first residue is used as the position of the k-mer.
k-mer length
k-mers up to 6 DNA/RNA residues or 3 protein residues are supported in the webserver, with the default being 1 to 4 for DNA/RNA and 1 to 2 for protein and other sequences. The command-line tool allows more flexibility in k-mer length. Please note that the number of all possible k-mers increases exponentially with length and thus has a large influence on the run time.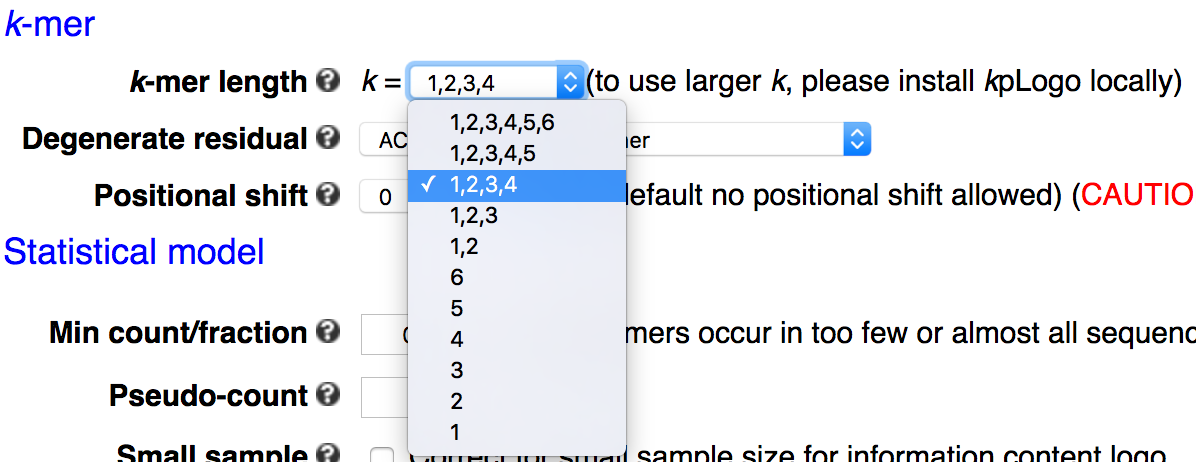
Degenerate residue (DNA/RNA)
Biological sequence signals can tolerate some mismatches, leading to degeneracy in the motif. For example, in addition to AAUAAA, AUUAAA is also used as a polyadenylation signal. Therefore a more general form of the polyadenylation signal is AWUAAA, where W is either A or U. kpLogo supports all degenerate codes defined in the IUPAC code for nucleic acids (see table below).
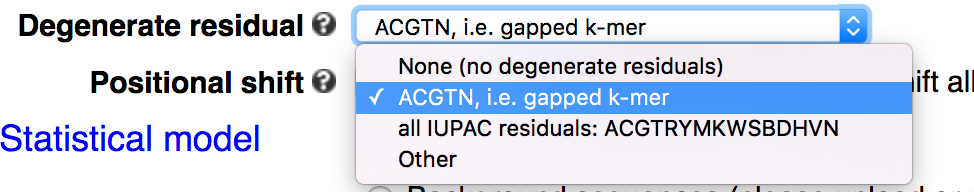
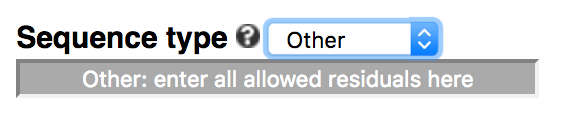
The default of the webserver is to allow N (any of A/C/G/T/U) in the middle of a k-mer, which represents a gapped k-mer (-degenerate ACGTN or simply -gapped). Users can choose to not include degenerate residues (default of command-line), use all IUPAC-defined residues (-degenerate all), or only allow a subset of IUPAC residues by choosing 'Other' in the dropdown menu.

For example, to allow only purine (R = A or G) and pyrimidine (Y = C or T), enter ACGTRY in the text box, including
non-degenerate residues.
| Symbol | Description | Bases represented | ||||
| A | Adenine | A | 1 |
|||
| C | Cytosine | C |
||||
| G | Guanine | G |
||||
| T | Thymine | T |
||||
| U | Uracil | U |
||||
| W | Weak | A | |
T |
2 |
|
| S | Strong | |
C |
G |
||
| M | aMino | A | C | |||
| K | Keto | |
G |
T |
||
| R | puRine | A | G |
|||
| Y | pYrimidine | |
C |
T |
||
| B | not A (B comes
after A) |
|
C |
G |
T |
3 |
| D | not C (D comes
after C) |
A |
|
G |
T |
|
| H | not G (H comes
after G) |
A |
C |
|
T |
|
| V | not T (V comes
after T and U) |
A |
C |
G |
|
|
| N | No idea |
A |
C |
G |
T |
4 |
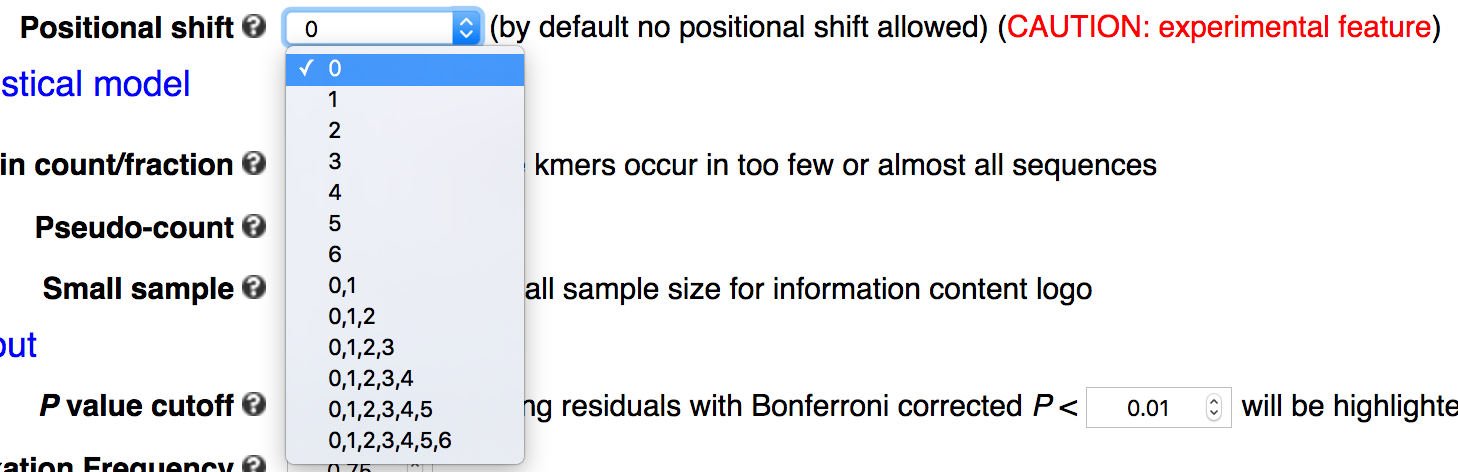
Positional shift (experimental)
In many cases, sequence motifs are well positioned but can tolerate some offset. Such positioning flexibility is modeled by the positional shift in kpLogo. For example, the canonical polyadenylation signal, AAUAAA, typically locates about 18 to 23 nucleotides upstream of the cleavage site, can be represented as AAUAAA:-23:5, i.e. the hexamer motif can be found at position -23, allowing a shift of 5, which means the motif can also occur at 5 other positions: -22, -21, -20, -19, and -18. In kpLogo, the position of a k-mer is defined as the position of the first residue in the k-mer, and positional shift is only allowed downstream of the start site, i.e. shift to the right. Positional shift is an experimental feature still under development. For example, currently it is not fully supported by some background models (See below).
By default no positional shift is allowed (shift = 0). In the webserver users can choose to use a shift up to 6. The command-line tool allows larger shifts.
Filter by positional k-mer
kpLogo allows user to filter input sequences by the presence (-select) or absence (-remove) of a list of positional k-mers. This feature enables one to study dependence between positional k-mers.

A positional k-mer is specified in the form of sequence:position:shift, or sequence:position using a default shift of 0. For example, GT:3:0 or GT:3 means GT starting at position 3 with no shift. Note that the sequence can contain degenerate residues. Position coordinates start at 1 for the first residue in each sequence.
To filter by multiple positional k-mers, separate each by a comma (,). For example, GT:3:0,ACT:11:0,GGG:45:0 (no space!). Note that when multiple positional k-mers are specified, the presence of any positional k-mer is defined as a match.
Here are two more examples:
-select G:35:3,CNC:47:0
Select (keep) sequences with G at position 35, 36, 37, or 38 (note shift = 3), OR with CNC at position 47. Here N means any nucleotide, thus can be any of CAC, CGC, CTC, and CCC. This will remove sequences that contain none of these positional k-mers.
-remove G:35:0,CNC:47:0
Remove sequences containing either G at position 35, or CNC at position 47. Sequences that contain neither of these two k-mers will be analyzed by kpLogo.
Statistical models
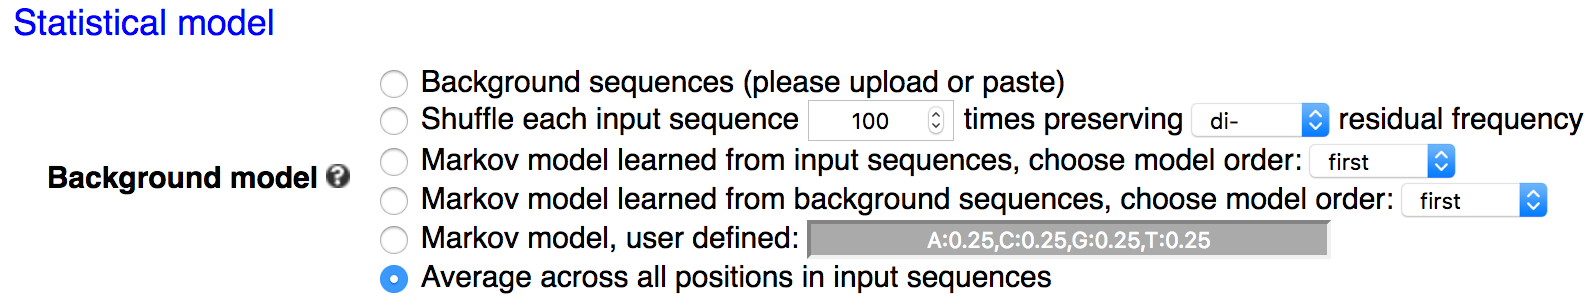
For a given value of k, kpLogo enumerates all possible k-mers (allowing degenerate residues when specified), determines their presence / absence at every possible positions in all input sequences, and reports their enrichment / depletion using statistical models specified by users.
Unweighted (default): binomial test
When neither-ranked nor -weighted is specified, kpLogo assumes the input is unweighted. kpLogo uses one-sided binomial tests to determine the significance of a k-mer at a position. Specifically, the number of trials is the total number of sequences, and the number of success is the number of sequences containing this k-mer at this position. The hypothesized probability of successes, i.e. the expected / background probability of a sequence containing this k-mer at this position, can be calculated in several ways as specified by users (see details below). A z-score is also reported in the output, assuming normal approximation. The sign of the z-score also indicates enrichment or depletion.The hypothesized probability of success can be calculated in five different ways:
Background
sequences. Users can provide a set of background sequences (-bgfile)
that can be aligned in the same way. In this case, the expected
probability of a sequence with a particular k-mer at a particular
position is estimated by the fraction of background sequences with
this k-mer at this position.
The potential advantage of using carefully selected background
sequences is that it may enrich desired signals by normalizing out
known or even unknown sequence bias. However, a background
sequence set may not be available or not large enough to for reliable
estimation of the expected probability of success. A small set of background
sequences can lead to noisy output, especially for longer k-mers. To avoid a zero estimation of expected probability, a pseudo-count is added to k-mer counts, which can be changed using -pseudo. The default value of the pseudo-count is 1.
-shuffle n,m (shuffle each sequence n times
preserving m-residue frequency). kpLogo uses the ushuffle
code to shuffle input sequences while preserving the frequency of
all
possible residue combinations of length specified by users. For
example,
in many genomic applications, DNA sequences are shuffled while
preserving di-nucleotide frequencies. Each sequence can be shuffled
multiple times (default = 100) to enable reliable estimation of the
background probability of sequences containing the k-mer at a
particular
position. However, this will lead to a linear increase in run
time. In
addition, for relatively short sequences, it is impossible to
preserve
even dinucleotide frequencies. As when using background sequences, a pseudo-count is used to avoid zero estimation of expected probability.
Markov
model from input sequences.
This is activated by -markov
specifying the order of the Markov model, which summarizes residue
frequency and dependence between neighboring residues in input
sequences. Currently kpLogo supports zero-, first-, and second-order
Markov
models. The hypothesized probability of a sequence containing a
particular k-mer at a particular position is then determined by the Markov model.
For example, the first-order Markov model learned from input
sequences
includes all mono- and di-residue frequencies, which directly serve
as
the hypothesized probabilities for k-mers of length 1 and 2. For
longer
k-mers, the hypothesized probability is calculated using the
property of
Markov models. For example, the probability of observing the k-mer
ABCD at a particular position is
Where p(AB), p(BC), p(CD), p(B), and p(C) are the fraction of AB, BC, and CD di-residues and the fraction of the residue B and C in the input sequences, respectively.
For zero-order Markov model:
For second-order Markov model:
The advantage over shuffling sequences is that it can be much faster and / or less noisy. However, at this moment Markov models do not accurately handle positional shifts and degenerate nucleotides (email authors for details), and does not support higher-order Markov models. Please choose other background models when either positional shift or degenerate residues is used.
Markov
model from background sequences.
This is activated when both -markov and -bgfile are specified. The only difference from -markov alone is that
the Markov model is learned from background sequences specified by -bgfile.
Average across all positions (default).
This is activated by default if none of the above models is
specified (-bgfile, -shuffle, -markov).
It is preferred because it is fast, less noisy, and handles both
positional
shift and degenerate residues. In this model, the hypothesized
probability of a sequence with a certain k-mer at a certain
position is
the average observed success rate (fraction of input sequences
containing this k-mer at a given position) averaged over all
positions.
Weighted: two-sample Student's t-test
When turned on by-weighted, kpLogo
searches for k-mers at certain positions whose presence / absence
in
a sequence is associated with higher / lower weights, respectively.
For
each k-mer at each position, all input sequences are divided into
two
sets: 1. positive sequences: sequences containing this k-mer at this position, allowing position shift and degenerate residues, if specified.
2. negative sequences: all other sequences, i.e., sequences that do not contain this k-mer at this position.
A
one-sided two-sample Student's t test is used to compare the weights of the two sets of sequences. The
sign
of the t statistics determines whether it is an enrichment
(sequences
with this k-mer at this position have larger weight) or depletion.Note that the input sequences need not to be sorted by weight.
Ranked: Mann-Whitney U test
When turned on (by-ranked), kpLogo assumes the input sequences (FASTA
or
Tabular) are ranked, and enrichment / depletion of a k-mer at a
position
means sequences with this k-mer at this position tend to be ranked
at
the top / bottom, respectively. Similar to weighted sequences, ranked sequences are divided into a positive set and a negative set based on the presence / absence of a k-mer of interest. Instead of Student's t-test, the nonparametric
Wilcoxon rank-sum test,
also called the Mann-Whitney U test,
is used to determine the significance of positional enrichment /
depletion of a k-mer. Assuming sample size larger than 8, the
distribution of the U statistics is approximated by a normal distribution. The resultant z-score and P value from the normal
approximation is reported in the output. Again the sign of the
z-score
determines enrichment or depletion.Note that this model is activated by the option
-ranked, which
will
ignore -weight if specified. Also note that ranked sequences need to be
sorted prior to kpLogo analysis.
Other parameters
Min count/fraction (-minCount): minimum number or fraction of sequences to have this k-mer to include in output. Default is 5. If a value between 0 and 1 is used, it will be interpreted as the minimum fraction.
Pseudo-count (-pseudo): pseudo-count added to background counts. default = 1. Ignored by Markov models -markov
Small-sample correction (-small): used for generating information content logos. See here.
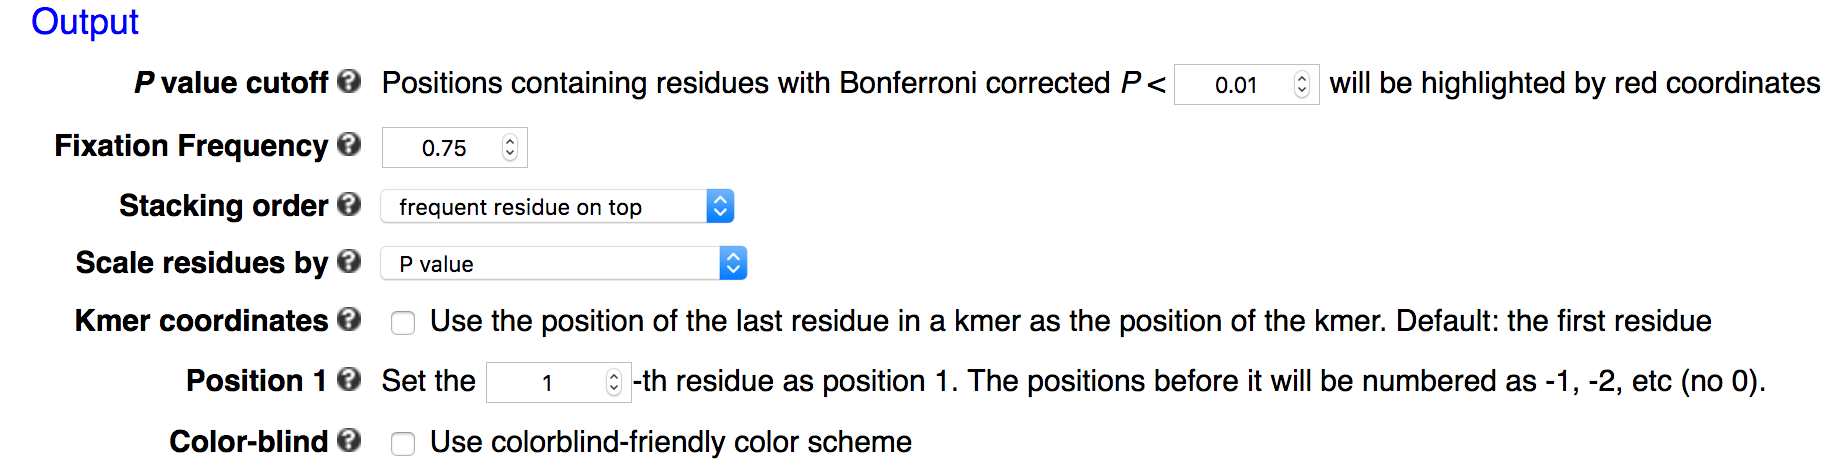
Output
kpLogo outputs both sequence logo plots and tabular data files.
Logo plots
Frequency logo
In frequency logos, residues are scaled relative to their frequencies at each position, and then stacked on top of each other with the more frequent residue on top of less frequent residue.
Information-content logo
Similar to frequency logos, in an information-content logo (conventional sequence logo) residues are scaled by frequency and stacked, and the total height of each position is further scaled relative to the information content, which is defined as
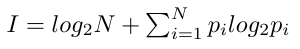
Here N is the number of residues in the alphabet (all possible residues that can occur at a position), and pi is the frequency of residue i at this position.
Probability logo
Probability logo is first proposed and implemented in pLogo for unweighted sequences, especially protein sequences. kpLogo extends the concept to ranked and weighted sequences. In probability logos, residues are scaled relative to the statistical significance (-log10(P value)) of each residue at each position. Enriched residues stack on the top, whereas depleted residues stack on the bottom. Significant positions have coordinates colored in red.
k-mer logo
kpLogo generates a new type of logo called k-mer logo to visualize motifs in addition to single residues. Stacked residues at a position represent a single motif (the most significant) starting (or ending) at this position. The total height is scaled relative to the significance of this motif. At each position, two motifs are shown, the most enriched on the top, and the most depleted on the bottom. Both read from top to bottom.
Significant positions
In probability logo and k-mer logo plots, positions containing residues with Bonferroni corrected P value smaller than a predefined cut-off will be highlighted by red coordinates. The default cutoff is 0.01 in the webserver.
Fixed positions
In many applications the input sequences may contain almost invariant residues at certain positions, such as GG in Cas9 guide-RNA target sequences (see example below). The statistical model would not work well for extremely imbalanced samples, or the p-values are so small that it is hard to see signal at other positions. kpLogo allows users to fix positions where a single residue occurs in more than 75% of the sequences. This maximum frequency can be changed using -fix option. P values for fixed positions will be ignored for probability logos, and the height of the fixed residue will be 1.1 times of the max total height of non-fixed positions. The coordinates for fixed positions will be highlighted by black coordinates.
Stacking order
In all logo plots other than k-mer logo, multiple residues can stack on top of each other. By default, residues with larger weights will be placed on top of residues with smaller weights. This can be reversed with -stack_order -1. To ignore weight information and use order specified by alphabet, use -stack_order 0.
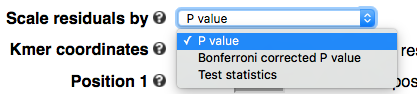
Scaling
By default residues or k-mers are scaled by -log10 transformed P values. To highlight more the significant motifs, one can plot Bonferroni corrected P values. One can also plot test statistics. In cases where P values are too small to be represented in the computer system (P < 1E-308 ), kpLogo will automatically switch to test statistics.
k-mer coordinates
By default, kpLogo assigns each k-mer to the position of its starting letter (i.e., most 5' or most N-terminal) and compares the significance of its enrichment to that of all other k-mers assigned to the same position. kpLogo also allows the option of assigning each k-mer to the position of its end letter. Comparing these two schemes using pri-miRNA sequences shows that known motifs sharing a start or end position with a stronger motif can be masked out in one scheme or the other but that the strongest motif among all overlapping ones was identified in both schemes.Position 1
In many cases it makes more sense to call some position other than the first residue as position 1. If this is the case the positions before it will be numbered as -1, -2, etc (no 0).

Tabular data file
Regardless the type of input (unweighted/ranked/weighted), the first six columns of the output data file are always the same:
- k-mer
- position: first nucleotide of the k-mer in the sequence.
- shift
- test statistics (positive for enrichment and negative for depletion)
- P value (-log10)
- Bonferroni corrected P value (-log10)
Output from ranked inputs has no other columns other than the six above. Note the statistics and P value in column 4 and 5 are based on normal approximation. See:
Unweighted inputs will generate four additional columns in the output:
- The observed fraction of input sequences with this k-mer at this position allowing this amount of shift
- The expected fraction of sequences with this k-mer at this position allowing this amount of shift
- ratio: column 7 divided by column 8
- column 7 divided by the average of other positions
- sample size for sample 1, i.e., the number of sequences that have this k-mer at this position when allowing this amount of shift.
- mean of weight for sample 1 sequences.
- standard deviation of weight for sample 1 sequences.
- sample size for sample 2, i.e., the number of sequences that do not have this k-mer at this position when allowing this amount of shift.
- mean of weight for sample 2 sequences.
- standard deviation of weight for sample 2 sequences.
Run time and input limit
For typical DNA/RNA analysis, the job should finish within a minute. Run time increases dramatically with increased k-mer length, and even more with protein sequences. The program imposes a limit of 10 million tests per job, which equals the number of k-mers multiplied by the number of positions (length of each sequence). On the webserver, the largest number of k-mers to be tested for protein is 20^1+20^2+20^3=8420 for k-mer of length (1,2,3), which limits the maximum length of each input sequence to 1188 (10,000,000 / 8420), a number large enough for most applications. This limit becomes much larger if users choose to use shorter k-mers. Similarly, for DNA/RNA sequence analysis, the limit on input sequence length is 1832 for k-mer length of (1,2,3,4,5,6) [=10,000,000/(4^1+4^2+4^3+4^4+4^5+4^6)] without considering degenerate letters. The limit will vary dramatically if users choose to use different degenerate letters. If the limit is reached, the webserver reports an error for too many tests, and users can go back and choose shorter k-mers and / or omit degenerate letters.
Here are a few examples:
42,481 protein sequences, each 40 amino acids long: It took 8 seconds, 1.5 minutes, and 34 minutes to run with a k-mer length up to 1, 2, and 3, respectively.
186 RNA sequences, each 50 nt long: It took 6 seconds to run with a k-mer length up to 4, allowing gaps (i.e. the degenerate letter N), but 14 minutes if allowing all degenerate letters (ACGTRYMKWSBDHVN).
Galaxy Tool Shed
kpLogo has been wrapped as a Galaxy tool and is available in Galaxy Tool Shed (click here). To run kpLogo in a local instance of Galaxy, one still needs to compile and install kpLogo locally (see next section), and add the executable kpLogo to the path, such that one can directly call kpLogo by typing "kpLogo" in a terminal window.
Install kpLogo locally
kpLogo is an open-source project and users can download the source code, compile and install locally to enable all functionality.
Requirements
kpLogo has been successfully tested on Linux and Mac.To compile: GCC
kpLogo is written in C++ and reuses some libraries from Boost version 1.57.0. To compile kpLogo locally, one should have a recent version of GCC that is compatible with the g++ option
-std=c++11.
To generate PNG and PDF files: ImageMagick & Ghostscript
Logos are generated in postscript (ps) files and then converted to PNG using the program convert in the package ImageMagick. In addition, Ghostscript is used to convert postscript files to PDF files.
Download
The kpLogo source code (including web code) is hosted on GitHub: https://github.com/xuebingwu/kpLogoTo clone the latest (may not be stable) version:
To download stable releases of kpLogo: https://github.com/xuebingwu/kpLogo/releases/
Installation
Once finished downloading, unzip if necessary, enter the subfolder
src,
then type make: make
The compiled programs are in the folder
bin.To recompile, type
make clean then make.Command-Line Options
Click here to view the command-line options in plain text
An enhanced html version is coming soon.
Examples
Here are two examples discussed in the kpLogo paper:Xuebing Wu and David Bartel (2017) kpLogo: positional k-mer analysis reveals hidden specificity in biological sequences, Nucleic Acids Research, in press.
1. Unweighted input: sequence features defining human microRNA genes
Data set
50 nt centered on the 3' end cleavage site of human microRNA hairpin [Download]Parameter setting
Web: no need to change default settings. If you want to re-number the coordinates such that the two nucleotides flanking the cleavage site are numbered as -1 and 1, respectively, set 'Position 1' to be 26 in the 'Output' option groups.
Full command line:
kpLogo premir50p3.fa -gapped -startPos 26 -pc 0.01
Output
kpLogo outputs four types of logos:
| Frequency Logo | 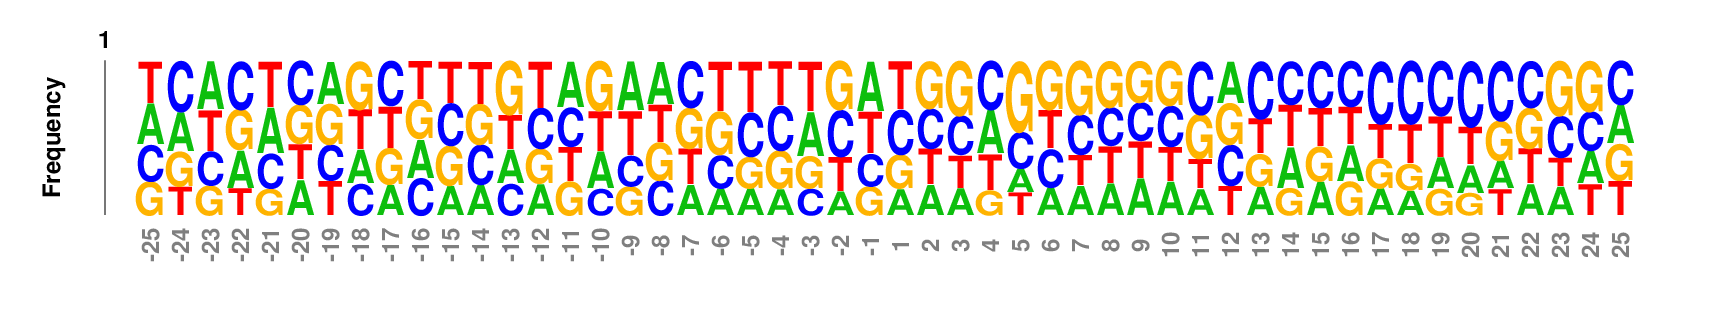
|
| Information Content Logo | 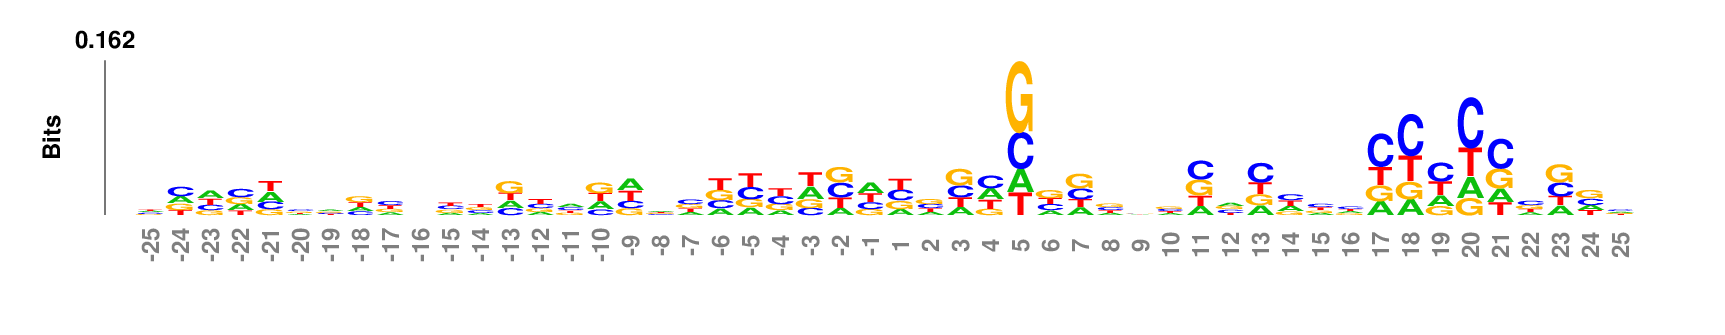
|
| Probability Logo | 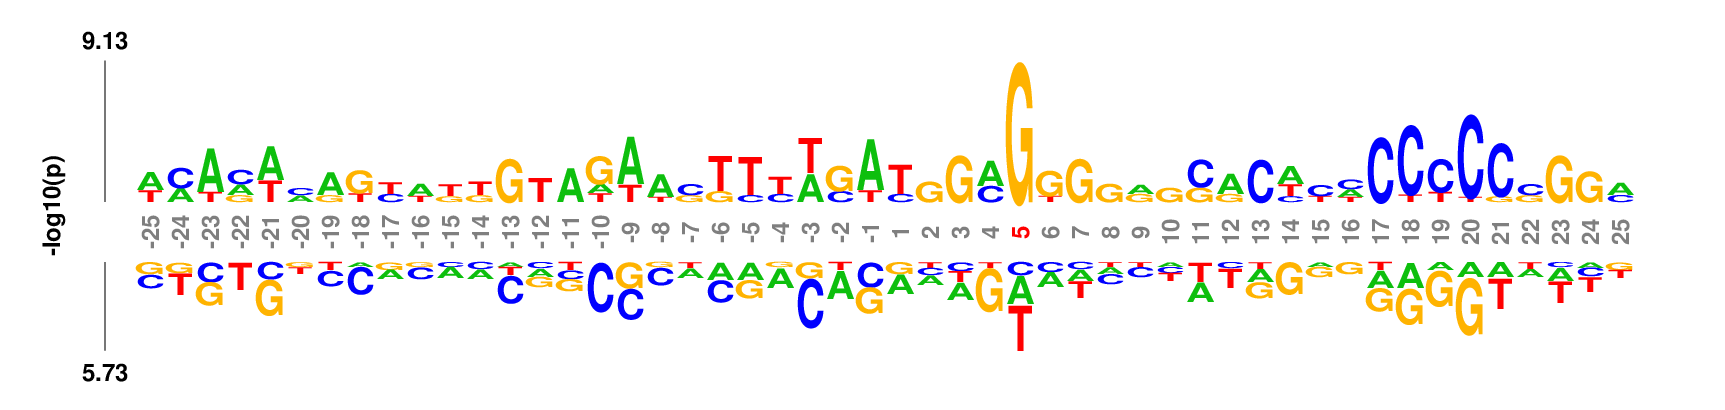
|
| k-mer Logo | 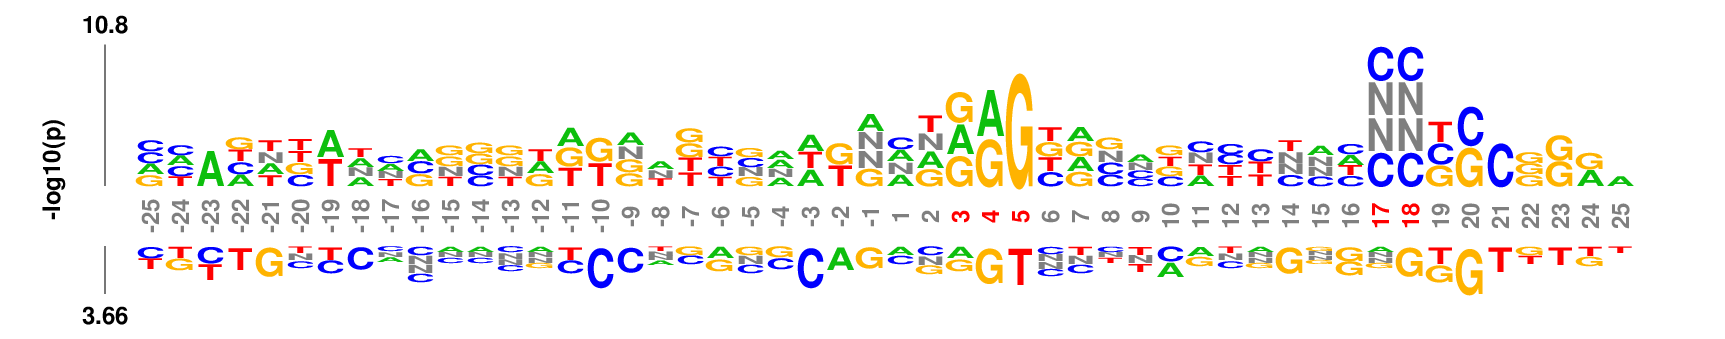
|
Weighted/Ranked: Sequence features for CRISPR/Cas9 guide RNA efficiency
Data set
30-nucleotide sequences around target regions of 1841 guide RNAs and associated cutting efficiency [Download]Parameter setting
Web: select 'Weighted' or 'Ranked' in the 'Input' option groups. They give similar results. If you want to re-number the coordinates such that the first nucleotide of the guide-RNA match is numbered as 1, set 'Position 1' to be 5 in the 'Output' option groups.
Full command line:
kpLogo gRNA.txt -weighted -gapped -startPos 5 -pc 0.01
kpLogo gRNA.txt -ranked -gapped -startPos 5 -pc 0.01
Output
kpLogo outputs four types of logos:
| Frequency Logo | 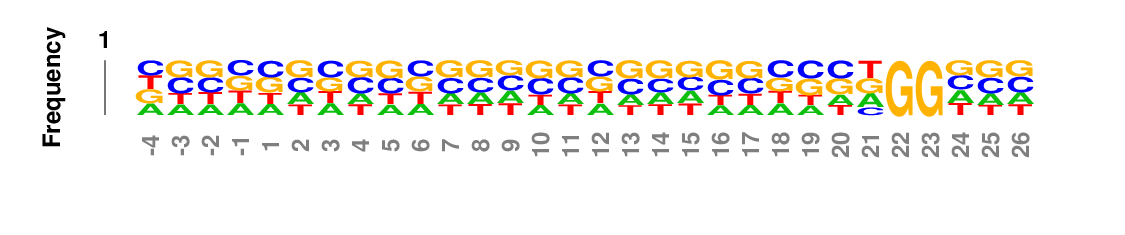
|
| Information Content Logo | 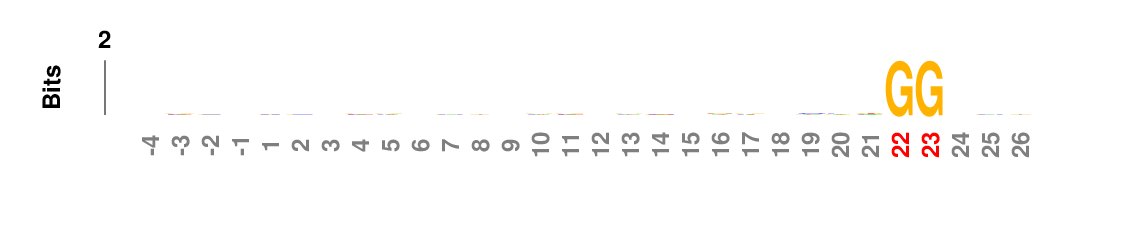
|
| Probability Logo | 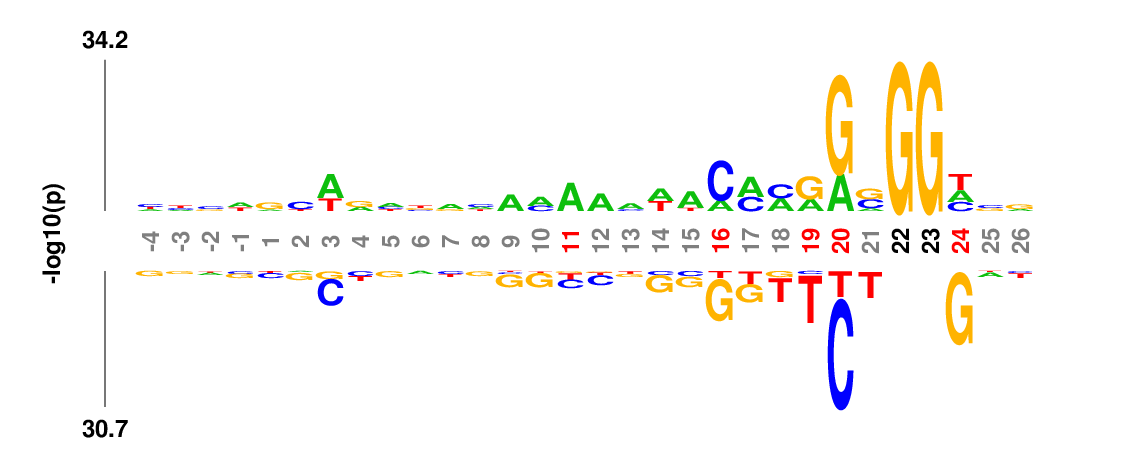
|
| k-mer Logo | 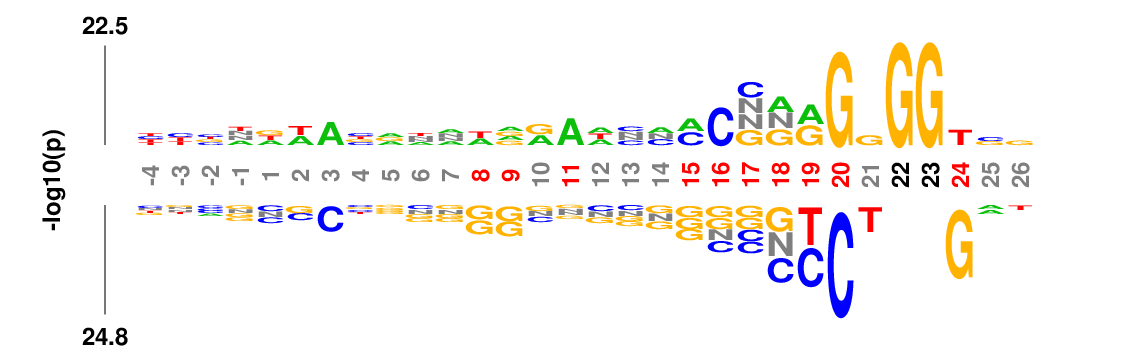
|
Prediction
The commandline version of kpLogo supports scoring of a list of new sequences using positional k-mer motifs learned from a previous run. Briefly, for a given sequence to be scored, the score is the sum of log10(p-value) of all positional k-mers present in the sequence.
As a toy example, here we will score the guide RNA sequences using the positional motifs we learned from themselves:
Full command line:
# training
kpLogo gRNA.txt -weighted -o model_training
# prediction
kpLogo gRNA.txt -predict model_training
# the output file model_training.score contains the score for each sequence
Copyright
Copyright (c) 2017 Xuebing Wu.
kpLogo reuses the following library/code:
- Boost library (version
1.57.0)
- The ushuffle
code written by Minghui Jiang
Author
kpLogo is developed and maintained by Xuebing Wu in the Bartel lab at Whitehead Institute.
Acknowledgements
I would like to thank Whitehead Institute IT system team (especially Paul McCabe, Andy Nutter-Upham, Craig Andrew, Alexan Mardigian) for help with the server setup.
Reference
Xuebing Wu and David Bartel (2017) kpLogo: positional k-mer analysis reveals hidden specificity in biological sequences, Nucleic Acids Research, in press.